Comprehensive Archive of Solar Event Research Databases and Basic Information on Understanding and Analyzing Them
Ongoing research · Started · Last updated
Why This Matters
This archive matters because solar events can impact Earth in ways that ripple through technology, communication, and infrastructure. Solar flares or geomagnetic storms, for example, can interfere with GPS systems and satellite networks that are vital for everything from navigation to communication. If universal time clock satellites go down, digital banking systems and financial markets can come to a halt, affecting global economies. Understanding these phenomena is crucial for preparing for such disruptions, whether in space weather forecasting or strengthening infrastructure resilience.
I’ve been building this archive as a go-to reference for understanding and researching solar activity, something I’ve been exploring more deeply over time. It brings together key databases, satellite tools, and foundational knowledge on solar events like CMEs, solar flares, and geomagnetic storms.
I organized it in a way that helps both beginners and fellow researchers get quick access to reliable sources (NASA, NOAA, ESA and others), plus a breakdown of coordinate systems (like heliocentric and Earth equatorial) that are crucial when working with space weather datasets.
Whether you're studying solar-terrestrial interactions, cosmic weather patterns, or just seeking a better grasp of heliophysics fundamentals, this archive is designed to help you build a foundational yet actionable knowledge base.
At the bottom of the page, there’s also an experimental analysis I added, some data that caught my attention during research and that I wanted to explore more closely. It’s still in progress, but I thought it was worth including as part of the bigger picture.
This is something I’ll keep updating as I go. My aim was to make it both practical and easy to return to whenever I or someone else needs it. If you see anything I can improve or have suggestions, feel free to leave a comment.
The file is divided into clear sections covering:
- Real-time & archived solar data sources (e.g., NASA, NOAA, ESA)
- Key solar phenomena such as CMEs, solar flares, sunspots, and solar wind
- Introductory resources for understanding heliophysics, geomagnetic storms, and space weather forecasting
- Technical tools & satellite data access points for practical exploration and modeling
- Important terminology & coordinate systems like heliocentric, geocentric, and Earth equatorial frames
Minimum Viable Emergency Concern Data Chart
To determine the minimum viable emergency concern for solar activity, a chart can be constructed using key space weather indices and thresholds that correspond to potentially hazardous impacts on critical infrastructure.
| Parameter | Metric | Emergency Concern Threshold | Implications |
|---|---|---|---|
| Kp Index | 0-9 (global geomagnetic scale) | Kp ≥ 7 (Severe storm level) | Potential power grid disruptions, satellite communication loss, auroras visible at low latitudes. |
| Dst Index | nT (nanoteslas) | Dst ≤ -200 (Severe geomagnetic storms) | Significant risk to satellites, increased GICs in power lines. |
| Solar Flare X-ray Flux | W/m² (measured by GOES) | X-class (≥10-4 W/m²) | Potential HF radio blackouts, satellite anomalies, and astronaut hazards. |
| Solar Proton Flux | pfu (protons/cm²/sec/sr) | ≥103 pfu (at >10 MeV energy) | Risk to satellites, GPS errors, and increased radiation exposure for flights. |
| Solar Wind Speed | km/s | ≥800 km/s | High-speed solar wind streams increase GIC risk and auroral activity. |
| Interplanetary Magnetic Field (Bz) | nT | Bz ≤ -10 nT | Southward Bz increases risk of geomagnetic reconnection, intensifying storms. |
| Electron Flux | e/cm²/sec/sr | ≥103 e/cm²/sec/sr | Satellite surface charging, increased risk of anomalies. |
| Coronal Mass Ejection (CME) Speed | km/s | ≥1500 km/s | Fast CMEs are more likely to trigger severe geomagnetic storms. |
| F10.7 Solar Flux | Solar flux units (SFU) | ≥200 SFU | High solar activity indicates increased ionospheric variability. |
Notes:
1. Threshold Levels: These values are based on operational guidance from agencies like NOAA’s Space Weather Prediction Center (SWPC), the European Space Agency (ESA), and other space weather research organizations.
2. Emergency Preparedness: When any of these thresholds are met or exceeded, operators of power grids, satellite systems, aviation, and communication infrastructure may need to implement protective measures, such as reducing transformer loads, activating storm-hardening protocols, or placing satellites into safe modes.
For current solar data to monitor these thresholds, refer to:
• NOAA SWPC Alerts (Space Weather Prediction Center)
• ESA Space Weather Service (ESA SWE Portal)
• NASA’s SOHO and SDO Missions (NASA SOHO and NASA SDO)
A Guide to Key Terms and Concepts
The CME Kp index
Here is a table of the K index (0–9) and its approximate corresponding magnetic field deviation in nanoTesla (nT) for mid-latitude observatories. Note that values may vary slightly depending on observatory calibration and latitude.
| K Index | Magnetic Deviation (nT) | Geomagnetic Activity |
|---|---|---|
| 0 | 0–5 | Quiet |
| 1 | 5–10 | Quiet |
| 2 | 10–20 | Quiet |
| 3 | 20–40 | Unsettled |
| 4 | 40–70 | Active |
| 5 | 70–120 | Minor Storm |
| 6 | 120–200 | Moderate Storm |
| 7 | 200–330 | Strong Storm |
| 8 | 330–500 | Severe Storm |
| 9 | > 500 | Extreme Storm |
Key Notes
- High-latitude observatories: The thresholds for each K index value can be higher because geomagnetic disturbances are more pronounced closer to the poles. For example, a K index of 9 might correspond to deviations >1000 nT at such locations.
- Planetary Kp index: The Kp index uses a similar scale but represents a global average rather than local deviations.
- Kp = 0–4: Quiet to Unsettled (Normal)
- Indicates low geomagnetic activity.
- Little to no risk for technological systems.
- Typical daily variations in the Earth’s magnetic field.
- Kp = 5: Minor Storm
- Minor geomagnetic storm level.
- Potential for minor disruptions in high-frequency radio communications, GPS accuracy, and satellite functions.
- Kp = 6–7: Moderate to Strong Storm (Increased Risk)
- Increased risk for geomagnetic disturbances.
- GPS, communication systems, and satellite operations may experience noticeable disruptions.
- High-latitude areas could experience auroras visible further south than usual.
- Kp = 8–9: Severe Storm (High Risk)
- Highest levels of geomagnetic activity.
- Severe effects on satellite systems, power grids, and long-range communication.
- High-altitude aircraft may experience navigation challenges, and auroras could be visible at very low latitudes.
Risks of High Kp Index Levels
When the Kp index is 5 or above, risk levels increase for:
- Satellite operations: Increased drag and radiation exposure, which can interfere with positioning and functionality.
- Power grid stability: Geomagnetically induced currents (GICs) can overload transformers and disrupt grid stability.
- Radio and GPS signals: High-frequency radio waves can be absorbed in the ionosphere, disrupting GPS and communication.
For typical tracking, the NOAA Space Weather Prediction Center and NASA both offer real-time Kp index data and predictions based on solar activity, allowing industries and individuals to prepare for high Kp levels and potential geomagnetic storms.
NOAA Space Weather Scales
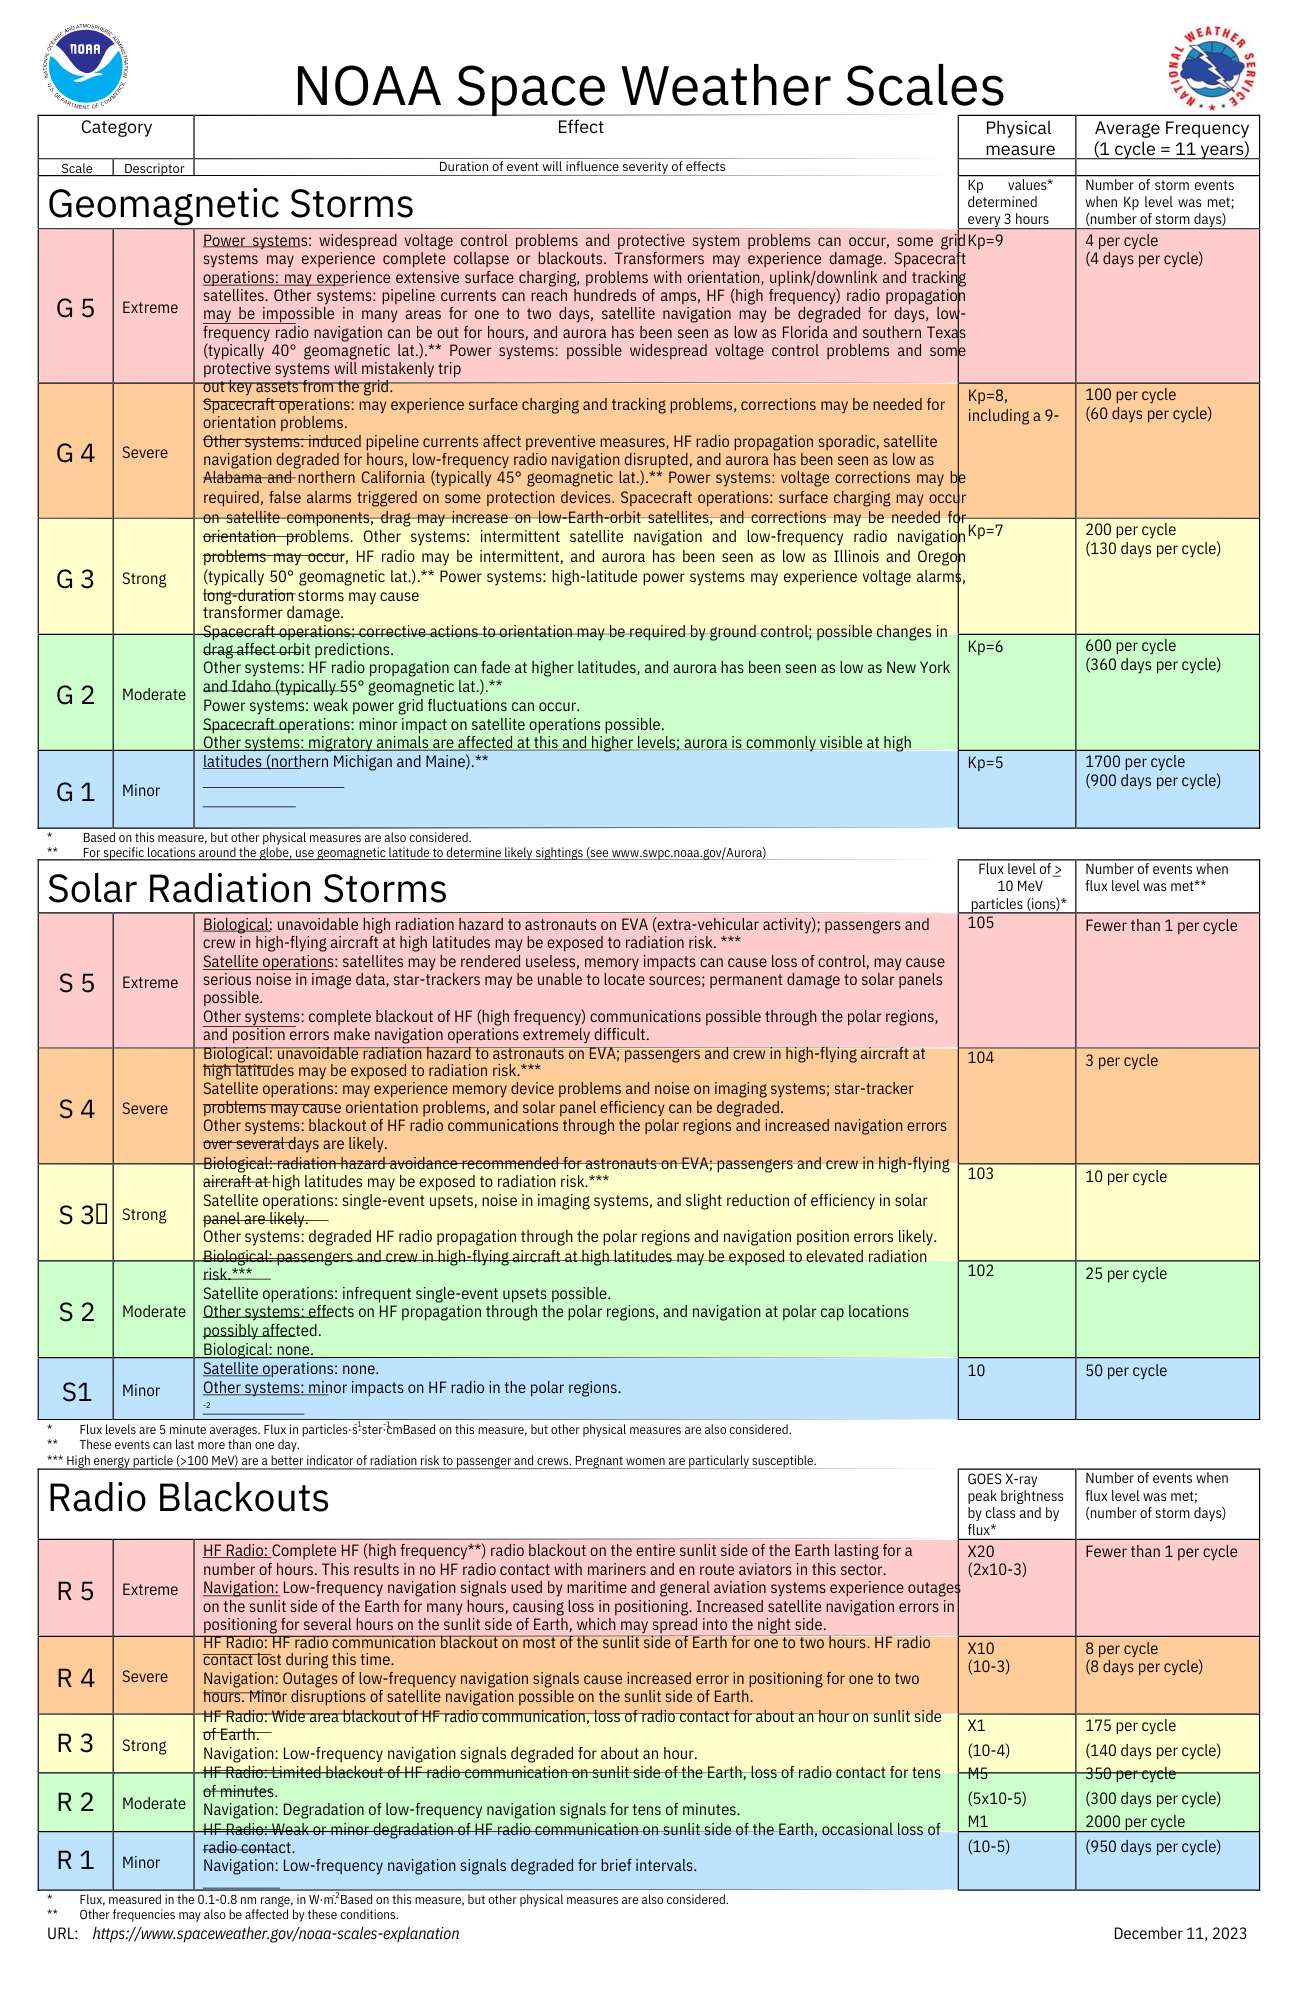
Solar Flare Intensity Categorization: GOES (Geostationary Operational Environmental Satellites) Class
GOES (Geostationary Operational Environmental Satellites) "Class" refers to the categorization of solar flares based on their X-ray brightness as observed by the GOES satellites. These satellites monitor solar activity in near-real-time, and flares are classified according to their intensity.
The solar flare classifications are based on the peak flux (in watts per square meter) of X-ray radiation detected in the 1 to 8 angstrom wavelength range. There are five main classes of solar flares:
- A-Class: The weakest category of flares, with X-ray flux below 10-7 watts per square meter.
- B-Class: These flares are 10 times more intense than A-Class flares, with flux between 10-7 and 10-6 watts per square meter.
- C-Class: Moderate intensity flares, with X-ray flux between 10-6 and 10-5 watts per square meter. These usually have minimal impact on Earth.
- M-Class: Strong flares, with flux between 10-5 and 10-4 watts per square meter. M-class flares can cause minor radiation storms and brief radio blackouts at higher latitudes.
- X-Class: The most powerful category, with X-ray flux greater than 10-4 watts per square meter. X-Class flares can trigger widespread radio blackouts and long-lasting radiation storms. The strength within the X-class can be further indicated by numbers (e.g., X1, X10), with X10 being 10 times more intense than X1.
These classes help scientists assess the potential impact of solar activity on Earth, particularly in terms of space weather phenomena like radio communication disruption and satellite operation.
Heliocentric Earth Equatorial (HEEQ) Coordinates Basics
Essential for interpreting space weather data, as they provide a standardized way of describing the positions and motions of solar features and spacecraft relative to the Sun–Earth line. Not to be confused with HEE (Heliocentric Earth Ecliptic), a related frame that uses the ecliptic plane instead of the solar equator.
1. Coordinate System Basics
- Heliocentric means that the coordinates are centered on the Sun.
- Equatorial refers to the Sun’s equatorial plane, not Earth’s.
- The frame is tied to Earth’s position, so the direction of Earth always sits at longitude 0°. This is what makes it useful in space weather: a solar event’s longitude tells you directly how far it is from facing Earth.
2. Axes and Units
- The HEEQ system is used in Cartesian coordinates (X, Y, Z) or spherical coordinates (radius, latitude and longitude). The spherical form is the Stonyhurst heliographic system used in NASA’s DONKI catalog.
- Z-axis: Along the Sun’s rotation axis, pointing to solar north.
- X-axis: Toward the point where the solar equator crosses the central meridian as seen from Earth, i.e. roughly the Sun–Earth direction.
- Y-axis: Completes the right-handed system, pointing toward solar west as seen from Earth.
- Units: Distances in solar radii or Astronomical Units (AU); angles in degrees.
3. Important Applications in Space Weather
- Solar Wind Tracking: By knowing the Earth’s position relative to the Sun, HEEQ coordinates allow for tracking the path and speed of solar wind particles, which impact Earth’s magnetic field and atmosphere.
- Geomagnetic Storms Prediction: These coordinates help predict when and where charged particles from solar events (like Coronal Mass Ejections, or CMEs) will intersect with Earth’s orbit.
- Radiation Levels & Satellite Protection: Satellites and spacecraft rely on this data to shield sensitive electronics from high-radiation zones, especially during solar storms.
4. Reading Data Sets
- HEEQ Latitude and Longitude: These values help you determine the location of solar phenomena relative to Earth. They are given as coordinates that are more “fixed” due to the Sun-centered perspective.
- Distance (R): Often, datasets will include distance from the Sun, particularly in AU. This can tell you how far a solar event or object is from the Sun and from Earth.
- Velocity and Direction: Speed (often given in km/s) combined with HEEQ coordinates helps you determine the arrival time of particles or shock waves heading toward Earth.
5. Making Assumptions and Predictions
- Propagation Time of Solar Events: Use HEEQ coordinates with the speed of a solar particle stream to estimate how long it will take to reach Earth.
- Geoeffective Potential: If a solar event (like a CME) is located near HEEQ longitude 0° (the Sun–Earth line), it’s more likely to have direct effects on our geomagnetic environment.
- Seasonal Variability: Earth’s position relative to the Sun changes throughout the year, so you can use HEEQ data to see seasonal patterns in solar wind interactions and geomagnetic activity.
Radio Blackout Levels & Thresholds
Solar radio blackouts occur when intense solar activity disrupts communication signals in the radio frequency range. These disruptions are mainly caused by solar flares, which release bursts of X-rays and extreme ultraviolet (EUV) radiation that ionize the Earth's upper atmosphere. This ionization increases the density of the ionosphere (particularly the D-layer), causing radio signal absorption and resulting in blackouts.
Key Terms
Ionospheric Layers Affected
- D-layer: The lowest part of the ionosphere (about 60-90 km altitude), mainly responsible for absorbing high-frequency (HF) radio signals during daylight conditions.
- Impact: Increased ionization in the D-layer during solar events leads to HF radio signal absorption, causing radio blackouts.
Radio Blackout Levels & Thresholds
The NOAA Space Weather Scales categorize radio blackouts from R1 (Minor) to R5 (Extreme), based on X-ray flux measurements.
R1 (Minor)
- Threshold: X-ray flux of M1.0 - M5.0 (10-5 to <10-4 Watts/m²)
- Effects: Minor degradation of HF radio communication at high latitudes; brief loss of radio contact.
R2 (Moderate)
- Threshold: X-ray flux of M5.0 - M9.9 (5x10⁻⁵ to <10-4 Watts/m²)
- Effects: Limited blackout of HF radio communication on the sunlit side of Earth; occasional loss of radio contact.
R3 (Strong)
- Threshold: X-ray flux of X1.0 - X9.9 (10-4 to <10-3 Watts/m²)
- Effects: Widespread HF radio blackouts on the sunlit side, impacting navigation signals for about an hour.
R4 (Severe)
- Threshold: X-ray flux of X10.0 - X19.9 (10-3 to <2x10⁻³ Watts/m²)
- Effects: Widespread HF radio blackouts, satellite navigation errors for hours, and major disruption of maritime, aviation, and emergency services communication.
R5 (Extreme)
- Threshold: X-ray flux of X20.0+ (≥2x10⁻³ Watts/m²)
- Effects: Complete HF radio blackout on the sunlit side of Earth for several hours, impacting navigation systems for days.
Impacts of Radio Blackouts
- High-Frequency (HF) Communication Disruption:
- HF radio frequencies (3 to 30 MHz) can be absorbed by the ionosphere during a blackout, leading to loss of radio communication, particularly affecting aviation, maritime, and military sectors.
- Navigation System Errors:
- GNSS (Global Navigation Satellite Systems) like GPS can be disrupted due to increased ionospheric errors during solar radio blackouts.
- Satellite Communication:
- Increased ionization can interfere with satellite-to-ground communication, impacting data relay, TV broadcasts, and other satellite services.
Prediction and Monitoring
- GOES Satellite Observations:
- The NOAA GOES satellites monitor the Sun’s X-ray output, providing real-time data that indicate the intensity of solar flares. This data is used to assess potential radio blackout conditions.
- Prediction Tools:
- Space weather prediction centers like NOAA SWPC and ESA SWPC offer forecasts based on solar activity, helping to predict the likelihood of radio blackouts.
- The D-Region Absorption Prediction (DRAP) model is a key tool that forecasts HF radio signal degradation due to solar flare activity.
Global D-Region Absorption Prediction Documentation
Global D-Region Absorption Prediction Documentation | NOAA / NWS Space Weather Prediction Center
Long-range communications using high frequency (HF) radio waves (3 - 30 MHz) depend on reflection of the signals in the ionosphere. Radio waves are typically reflected near the peak of the F2 layer (~300 km altitude), but along the path to the F2 peak and back the radio wave signal suffers attenuation due to absorption by the intervening ionosphere.
Trusted Sources for Geomagnetic Storm Predictions Data
To access geomagnetic storm prediction data, you can explore several authoritative sources that provide real-time space weather updates, predictions, and historical datasets.
1. NOAA's Space Weather Prediction Center (SWPC)
- Website: SWPC
- Data Provided: The SWPC provides real-time alerts, forecasts, and observations of geomagnetic storms. They offer a 3-day geomagnetic storm forecast and provide KP index predictions, which are indicators of geomagnetic storm strength.
- Datasets: Access datasets under the “Data and Products” section for raw data and models. They have both visual and tabular formats.
- Tools: They also offer API access for downloading specific space weather parameters.
2. NASA Goddard Space Flight Center
- Website: NASA GSFC Space Weather Research Center
- Data Provided: Includes solar wind, geomagnetic conditions, and predictions for space weather. They offer tools for tracking solar activity that could impact geomagnetic conditions.
- Resources: Look for real-time predictions and solar imagery that can indicate storm potential.
3. European Space Agency (ESA) Space Weather Coordination Centre
- Website: ESA SWPC
- Data Provided: Geomagnetic forecasts and detailed analysis for Europe. ESA provides services that allow you to monitor the solar and space environment.
- Tools: Explore their Space Weather Portal for data visualization and prediction models.
4. Solar and Heliospheric Observatory (SOHO)
- Website: SOHO Data Archives
- Data Provided: SOHO provides solar wind data and solar observations, which are vital for predicting geomagnetic storms. They offer near-real-time images of solar activity.
- Datasets: SOHO data is useful for understanding and predicting geomagnetic storm occurrences based on solar observations.
5. British Geological Survey (BGS) Geomagnetism
- Website: BGS Geomagnetism
- Data Provided: The BGS provides geomagnetic activity forecasts and updates on solar conditions impacting the Earth's magnetic field. They also offer data on the local geomagnetic field conditions in the UK.
- Tools: The BGS site provides a detailed geomagnetic activity index and prediction tools.
6. Space Weather Live
- Website: Space Weather Live
- Data Provided: This website aggregates data from various sources, including NOAA and SOHO. They offer forecasts, KP index predictions, and alerts on geomagnetic storms.
- Visualization: Provides visual tools for monitoring solar activity, KP index changes, and geomagnetic disturbances.
7. International Space Environment Service (ISES)
- Website: ISES
- Data Provided: A collaborative network of space weather organizations providing geomagnetic predictions, space weather alerts, and regional data.
- Resources: Access their data archives for historical geomagnetic storm events and forecast trends.
ESA Index Of International Organisations
https://assetdb.ssa-swe.eu/index.php?page=org_list&type=browse
ESA Index Of International Scientific Research Assets
https://assetdb.ssa-swe.eu/index.php?page=asset_list&type=browse
NASA Space Physics Data Facility
SPDF Home
The Heliospheric Physics Laboratory (HPL), located at NASA's Goddard Space Flight Center in Suburban Maryland, USA, operates the Space Physics Data Facility (SPDF) and its S3C Active Archive. HPL is a component of Goddard's Heliophysics Division of the Sciences and Exploration Directorate.
Space Weather Alerts
SpaceWeatherLive.com | Real-time data and plots auroral activity
Real-Time solar activity and auroral activity data website
D Region Absorption Predictions (D-RAP) Radio Signal Degradation Monitoring
A key tool that forecasts HF radio signal degradation due to solar flare activity.
D Region Absorption Predictions (D-RAP) | NOAA / NWS Space Weather Prediction Center
The D-Region Absorption Product addresses the operational impact of the solar X-ray flux and SEP events on HF radio communication. Long-range communications using high frequency (HF) radio waves (3 - 30 MHz) depend on reflection of the signals in the ionosphere. Radio waves are typically reflected near the peak of the F2 layer (~300 km altitude), but along the path to the F2 peak and back the radio wave signal suffers attenuation due to absorption by the intervening ionosphere.
The Wilcox Solar Observatory
WSO - The Wilcox Solar Observatory
The Wilcox Solar Observatory (WSO) began collecting daily observations of the
Sun's
global (or mean) magnetic field in May 1975
(Scherrer+1977),
with the goal of understanding changes in the
Sun
and how those changes affect the Earth. That science is called
space weather.
Since May 1976 daily low-resolution maps of the Sun's magnetic field have been made at WSO,
along with observations of solar surface motions.
The observatory is located in the foothills just south of the
Stanford University main campus.
Browse SDO Data
SDO | Solar Dynamics Observatory
SDO is designed to help us understand the Sun's influence on Earth and Near-Earth space by studying the solar atmosphere on small scales of space and time and in many wavelengths simultaneously.
The SOHO Archive
The SOHO Archive
These mission-long bundles begin in 1996 and their content is automatically updated with latest data as they become available by the
instrument teams. These data products are also available for download from the SOHO Archive.
SolarSoft Latest Events: Image-Based Solar Data
SolarSoft Latest Events Archive
Stanford Solar Center
Stanford Solar Center
The Stanford Solar Center provides teachers, students, and the interested public with activities and information related to the Sun.
25.10.2024: CME Direct Earth Impact, DONKI Data Analysis
Model Inputs: 2024-10-24T03:48:00-CME-001 with CME Analysis: Lon.=-36.0, Lat.=-14.0, Speed=2006.0, HalfAngle=50.0, Time21.5=2024-10-24T05:37Z
Related DONKI Data
View Space Weather Activity
CCMC DONKI Application
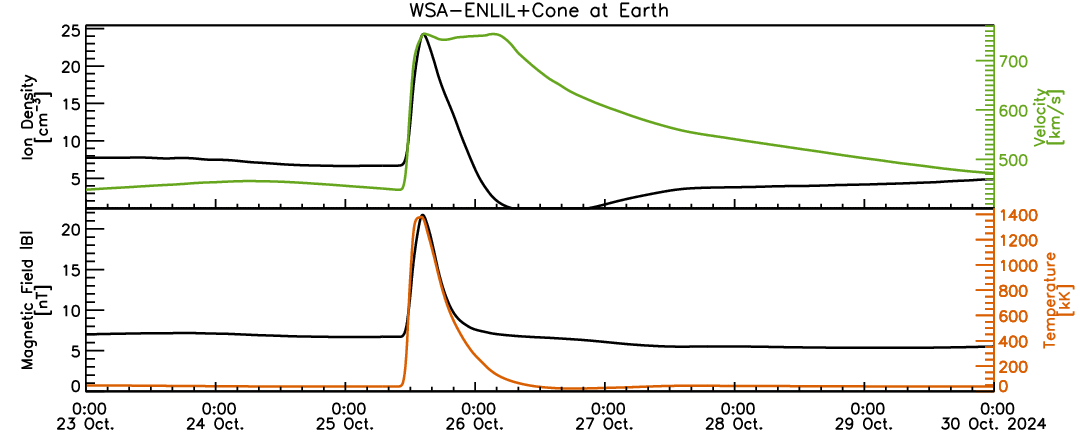
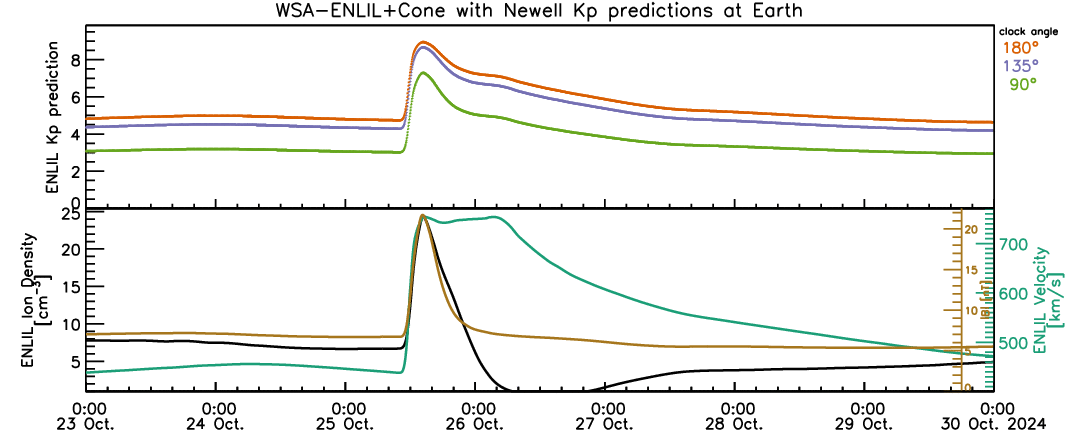
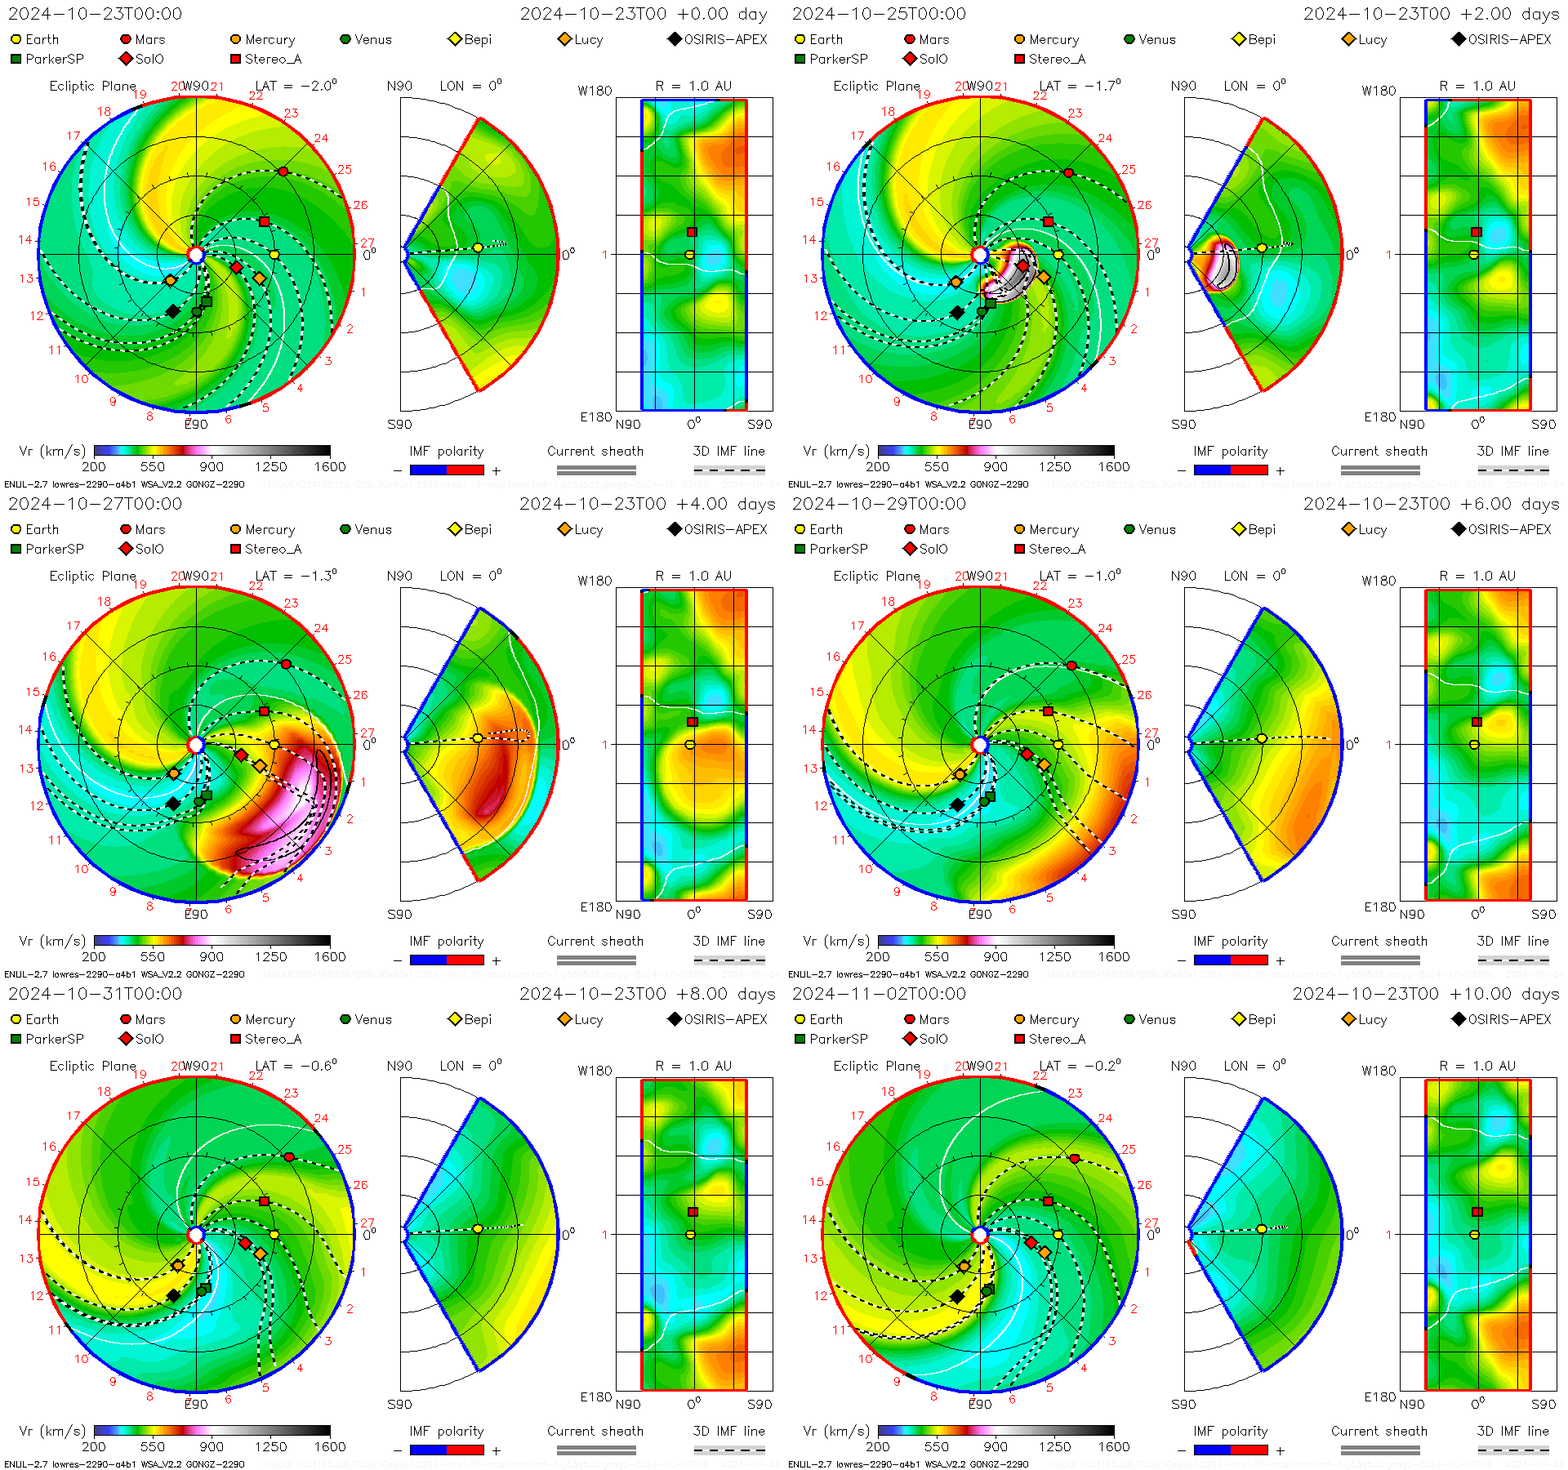
WSA-ENLIL+Cone Model For 2.0 AU with Completion Time: 2024-10-24T17:01Z
Model Inputs:
2024-10-24T03:48:00-CME-001 with CME Analysis: Lon.=-36.0, Lat.=-14.0, Speed=2006.0, HalfAngle=50.0, Time21.5=2024-10-24T05:37Z
Model Outputs:
Earth Impact:
Earth Shock Arrival Time = 2024-10-25T10:44Z (+- 7 hours)
Duration of disturbance (hr) = 25.2 (+- 8 hours)
Minimum magnetopause standoff distance: Rmin(Re) = 5.1
Possible Kp index:
(kp)90=7
(kp)135=9
(kp)180=9
Other Location(s) Impact:
Lucy with estimated shock arrival time 2024-10-25T03:31Z
Parker Solar Probe with estimated shock arrival time 2024-10-25T00:20Z
Solar Orbiter with estimated shock arrival time 2024-10-24T18:16Z
Mars with estimated shock arrival time 2024-10-28T08:00Z (Glancing Blow)
OSIRIS-APEX with estimated shock arrival time 2024-10-26T12:00Z (Glancing Blow)
STEREO A with estimated shock arrival time 2024-10-26T00:00Z (Glancing Blow)
Historical Solar Maximum Study Data At Hand
The most significant geomagnetic storms on record, with dates, severity levels and Kp indices:
| Name/Event | Date(s) | Severity Level | Kp Index | Description/Impacts |
|---|---|---|---|---|
| Carrington Event | 1-2 September 1859 | Extreme (G5+) | Estimated 9 | Largest recorded geomagnetic storm; caused auroras visible at low latitudes and widespread telegraph disruptions. |
| May 1921 Storm | 13-15 May 1921 | Extreme (G5) | Estimated 9 | Damaged communication systems, including telegraph networks, and caused fires in some telegraph stations. |
| March 1989 Storm | 13-14 March 1989 | Severe (G4-G5) | 9 | Caused the collapse of Quebec’s power grid, satellite malfunctions, and auroras visible as far south as Texas. |
| Halloween Storms | 29-31 October 2003 | Severe (G4-G5) | 9 | Disrupted GPS, satellites, and aviation communication; visible auroras in mid-latitudes. |
| St. Patrick's Day Storm | 17 March 2015 | Severe (G4) | 8 | Impacted GPS systems and satellite operations, with auroras visible at lower-than-normal latitudes. |
These storms are linked to significant solar activity, such as coronal mass ejections (CMEs), and their impacts often affect power grids, communication systems, and satellite operations. For more detailed event-specific analysis, refer to NOAA or USGS space weather archives.
May 10–12, 2024
In May 2024, an extremely severe geomagnetic storm reached G5 levels (Kp = 9) and had profound effects on Earth, including auroras visible at unusually low latitudes, such as in parts of Turkey. This storm, occurring from May 10 to 12, was driven by consecutive coronal mass ejections (CMEs) from solar active regions NOAA 13664 and 13668, which also produced several X-class flares.
Key Data from the Storm
- Kp Index: Peaked at 9 during several intervals, marking the highest geomagnetic storm level.
- Dst Index: Reached -412 nT on May 11, one of the strongest readings since 1957.
- Auroral Visibility: Extended down to about 29.8° latitude, with reports of auroras in regions as far south as Istanbul and Spain.
- Solar Wind Speed: Sustained at 700-800 km/s during the peak.
- Interplanetary Magnetic Field (Bz): Reached extreme negative values, down to -50 nT.
SOHO and SDO data captured multiple solar flares and CMEs leading up to the event. Observations showed intense magnetosphere compression, with significant ionospheric and atmospheric disturbances globally. This storm disrupted satellite operations, GPS signals, and caused communication issues.
For an in-depth analysis, you can consult datasets and images from platforms such as NASA's SOHO and SDO archives or relevant research papers documenting the event.
The solar storm of July 23, 2012
Often referred to as a "near miss" Carrington-level event, originated from solar active region 1520 and featured a powerful coronal mass ejection (CME) with an initial speed of over 2500 km/s. It was detected by NASA's STEREO-A spacecraft, which recorded the event as it passed 19 hours later. If this CME had been Earth-directed, it could have caused a geomagnetic disturbance far exceeding the Carrington Event of 1859, with a Dst index potentially reaching -1182 nT.
Such an event could have had devastating impacts on Earth's technological infrastructure, including power grids and communication systems.
Leave a comment here:
Comments